Role: Product Designer, Product Manager
The Observatory of Economic Complexity (OEC) is one of the world's leading platforms for exploring international trade data, used by economists, policymakers, academics, and business leaders across 190+ countries. As Senior Product Manager, I owned the end-to-end product strategy — from roadmap prioritisation to launch — while working at the intersection of data science, design, and go-to-market.
The Challenge
OEC had an exceptional dataset and a loyal niche audience, but was struggling to grow beyond expert users. The platform felt impenetrable to non-specialists, churn was high among new subscribers who couldn't find value fast enough, and there was no clear freemium strategy to convert free users into paying ones. My mandate was to make world-class economic data accessible to anyone — and turn that accessibility into revenue.
My Role
I led a cross-functional team of engineers, data scientists, economists, and designers. I was responsible for the product vision, roadmap, OKR definition, user research programme, and go-to-market strategy. I also acted as the primary point of contact for institutional partners and government clients.
What I Did
Defined a user research programme from scratch.
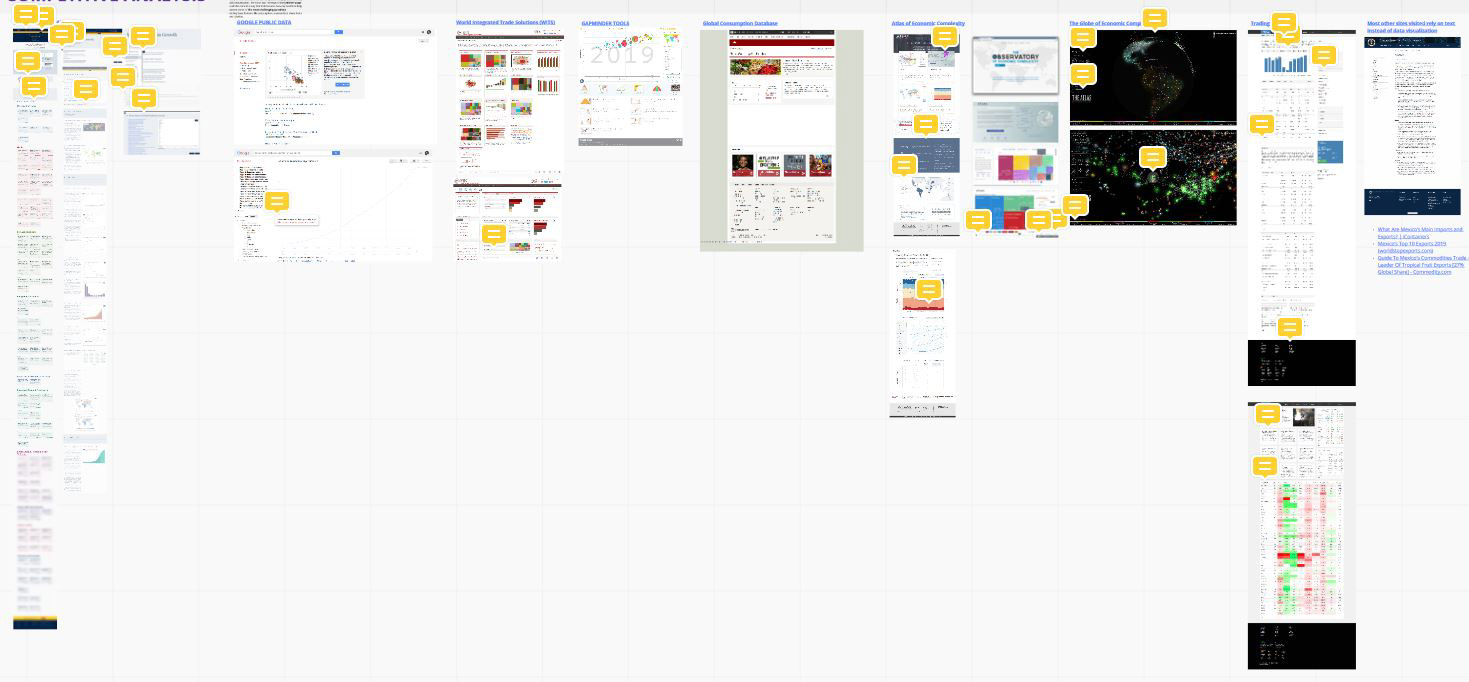
I ran continuous user interviews, surveys, and usability tests (Google Analytics, Hotjar) to map distinct personas — from seasoned trade analysts to first-time policy researchers. This research directly drove every prioritisation decision.
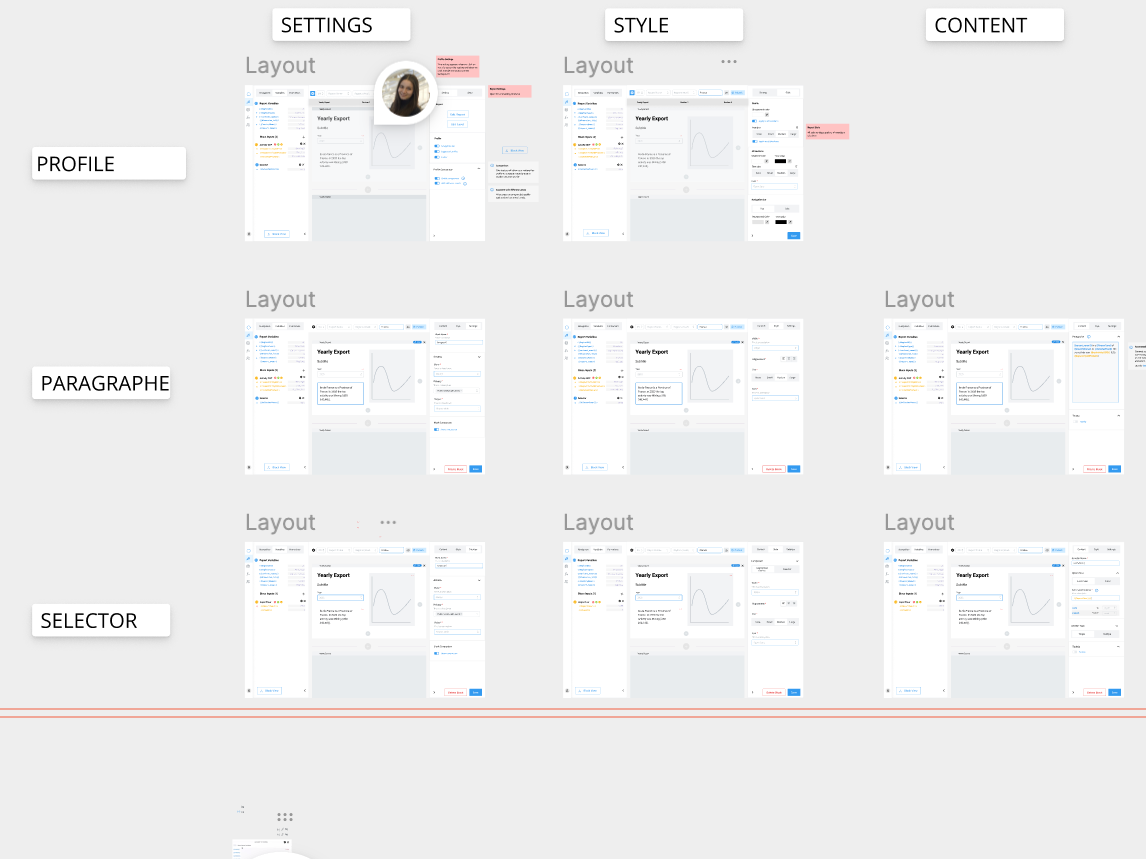
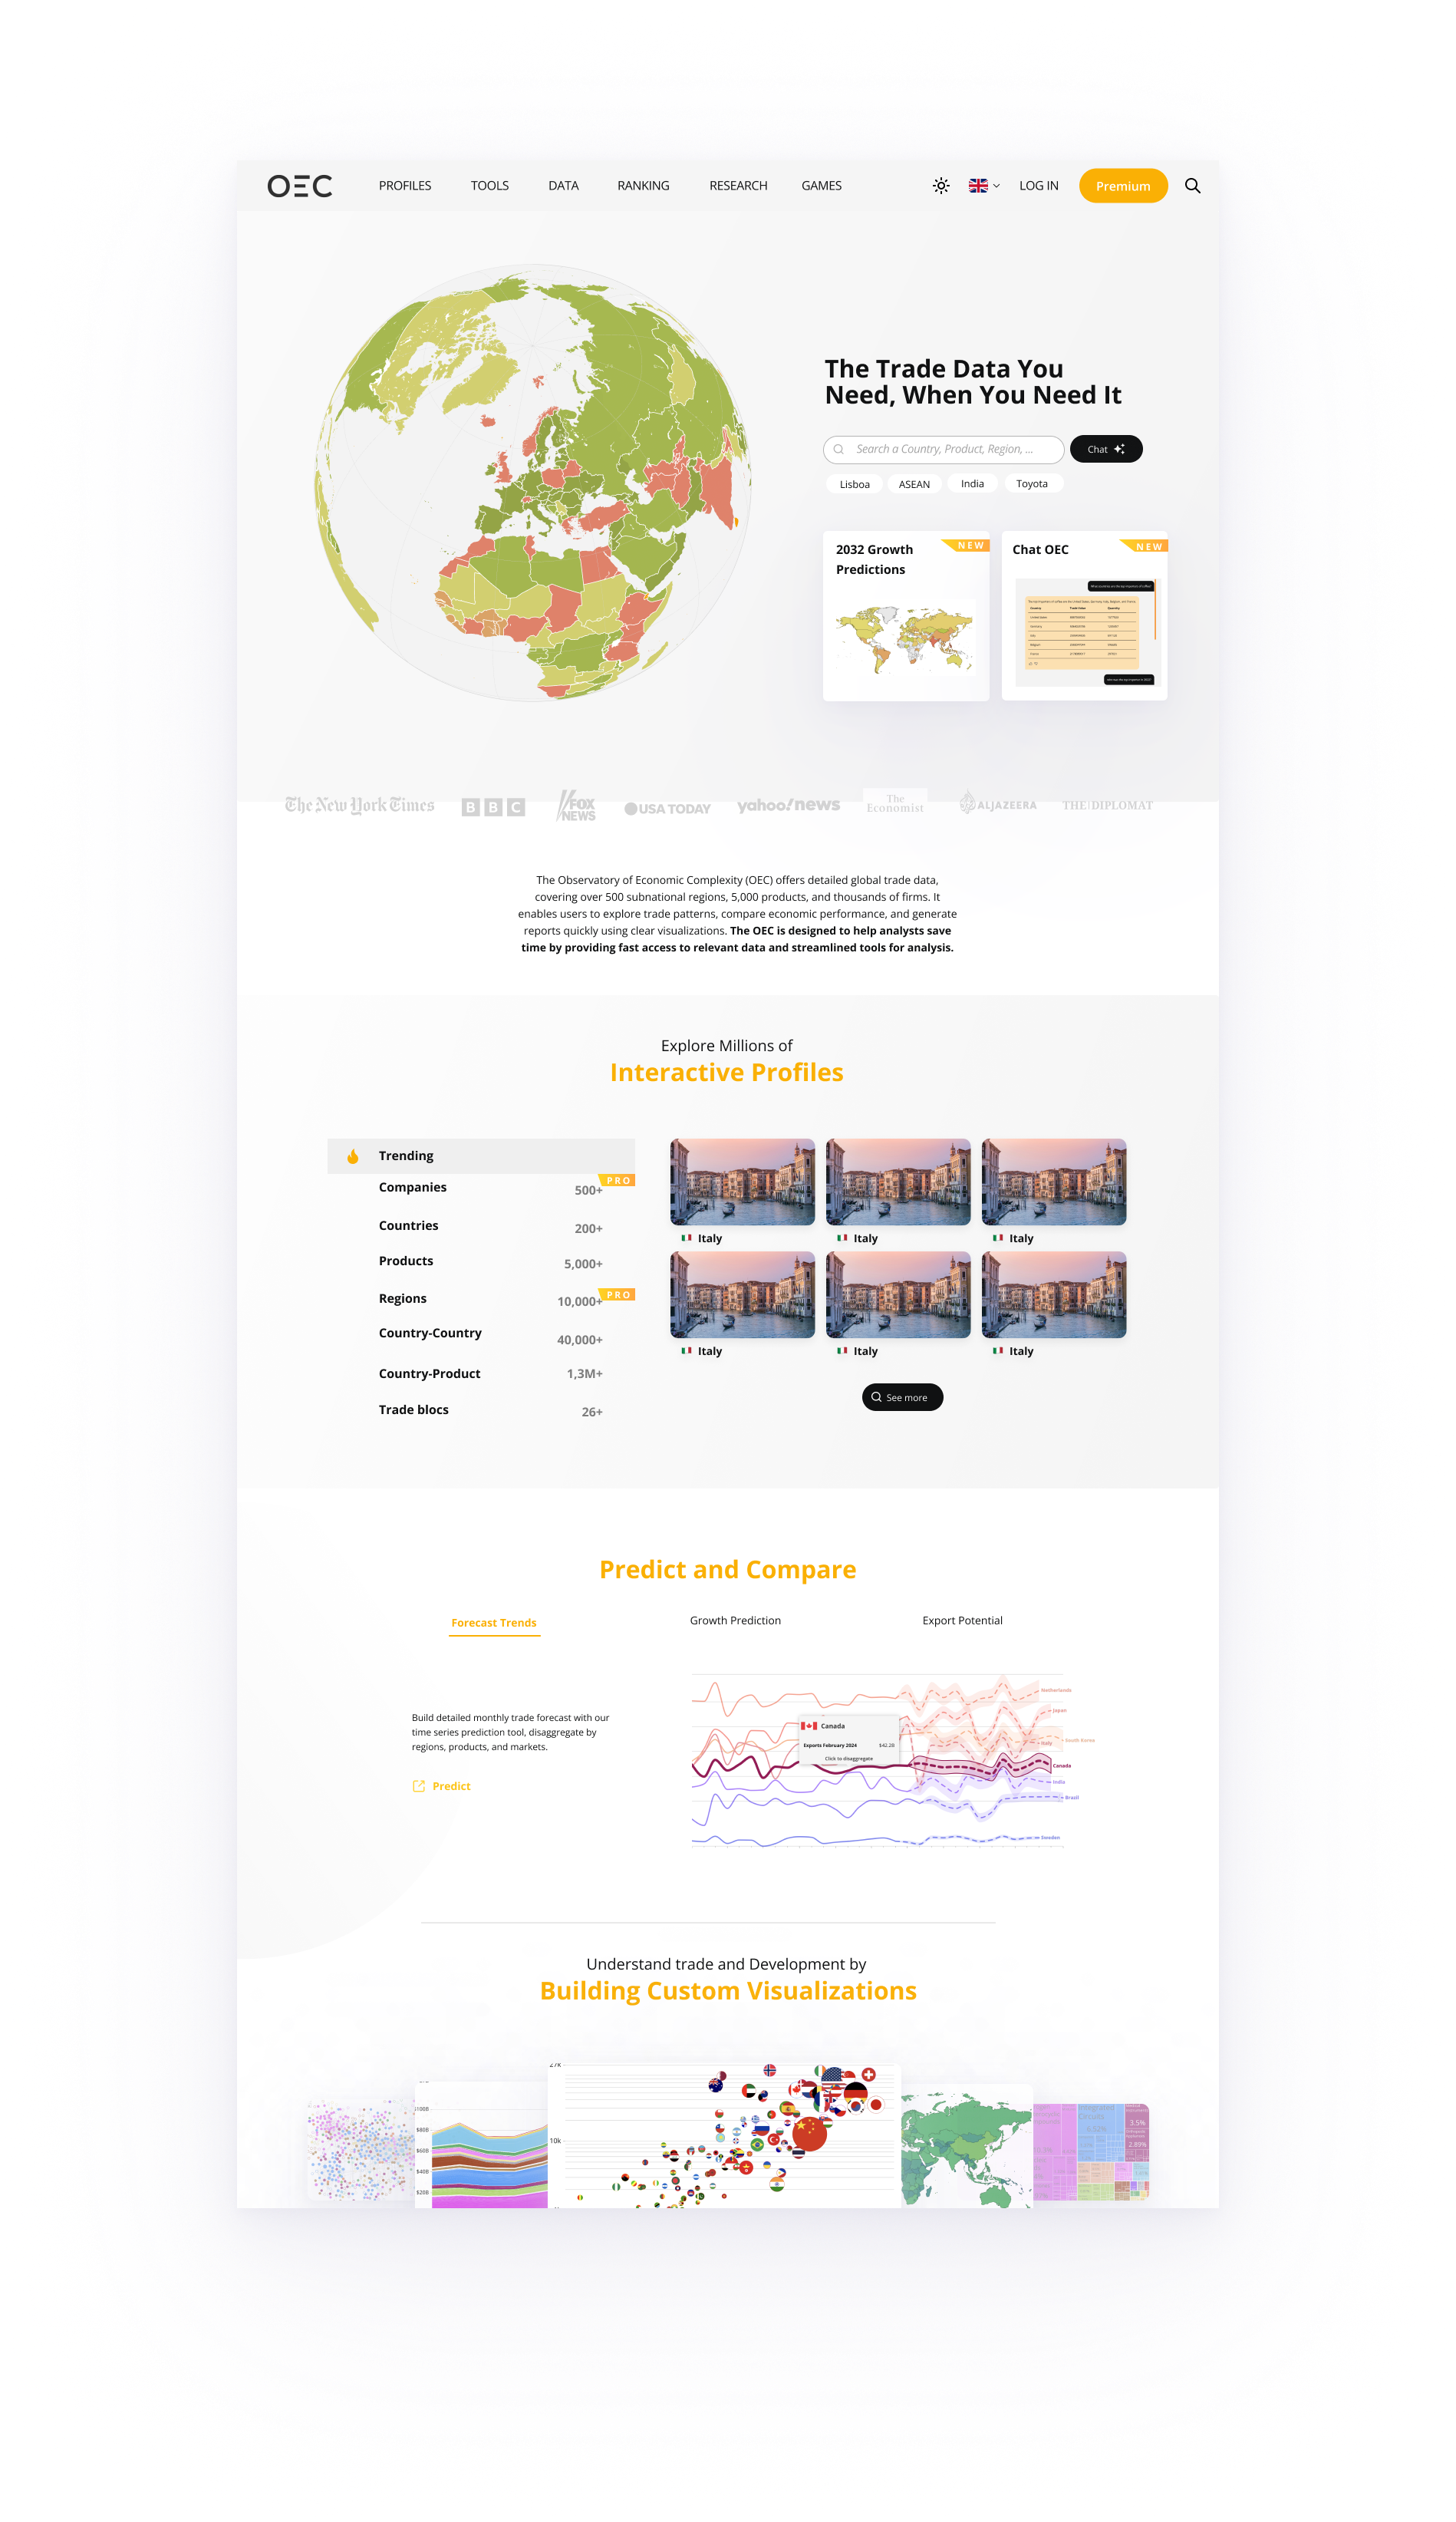
Redesigned the homepage and core user journey.
The previous homepage assumed expert knowledge. I led a full redesign focused on immediate value communication: surfacing the platform's differentiators clearly, making complex data feel approachable, and introducing premium features progressively without alienating free users.
Built the freemium and retention strategy.
To reduce churn, I introduced tutorial-driven onboarding that showed new subscribers concrete use cases within their first session. I also worked with our economics team to launch a data-driven newsletter using OEC's pro features — turning the product itself into a marketing channel.
Gamified data exploration to drive top-of-funnel growth.
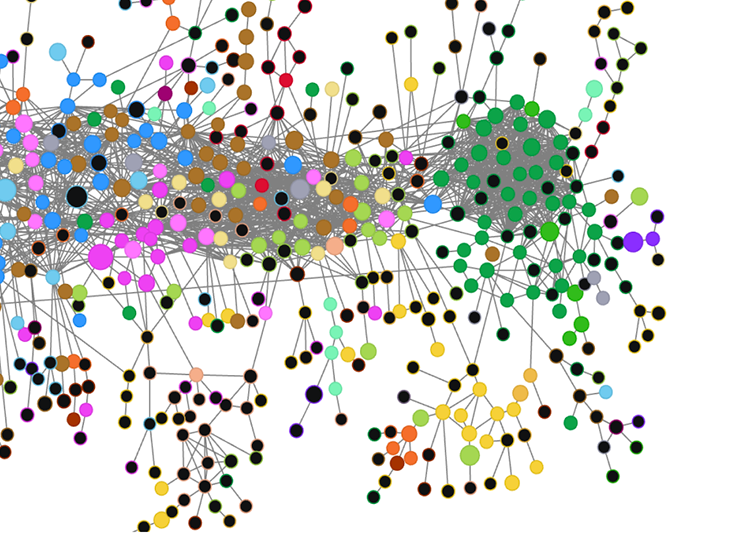
I designed and shipped free educational games that made trade data interactive and shareable. They went viral within academic and policy communities, meaningfully expanding our user base beyond direct search.
Shipped three high-impact tools for institutional clients:
Trend Explorer — Rebuilt to support data disaggregation and AI-powered forecasting, enabling users to model economic trends without technical expertise.
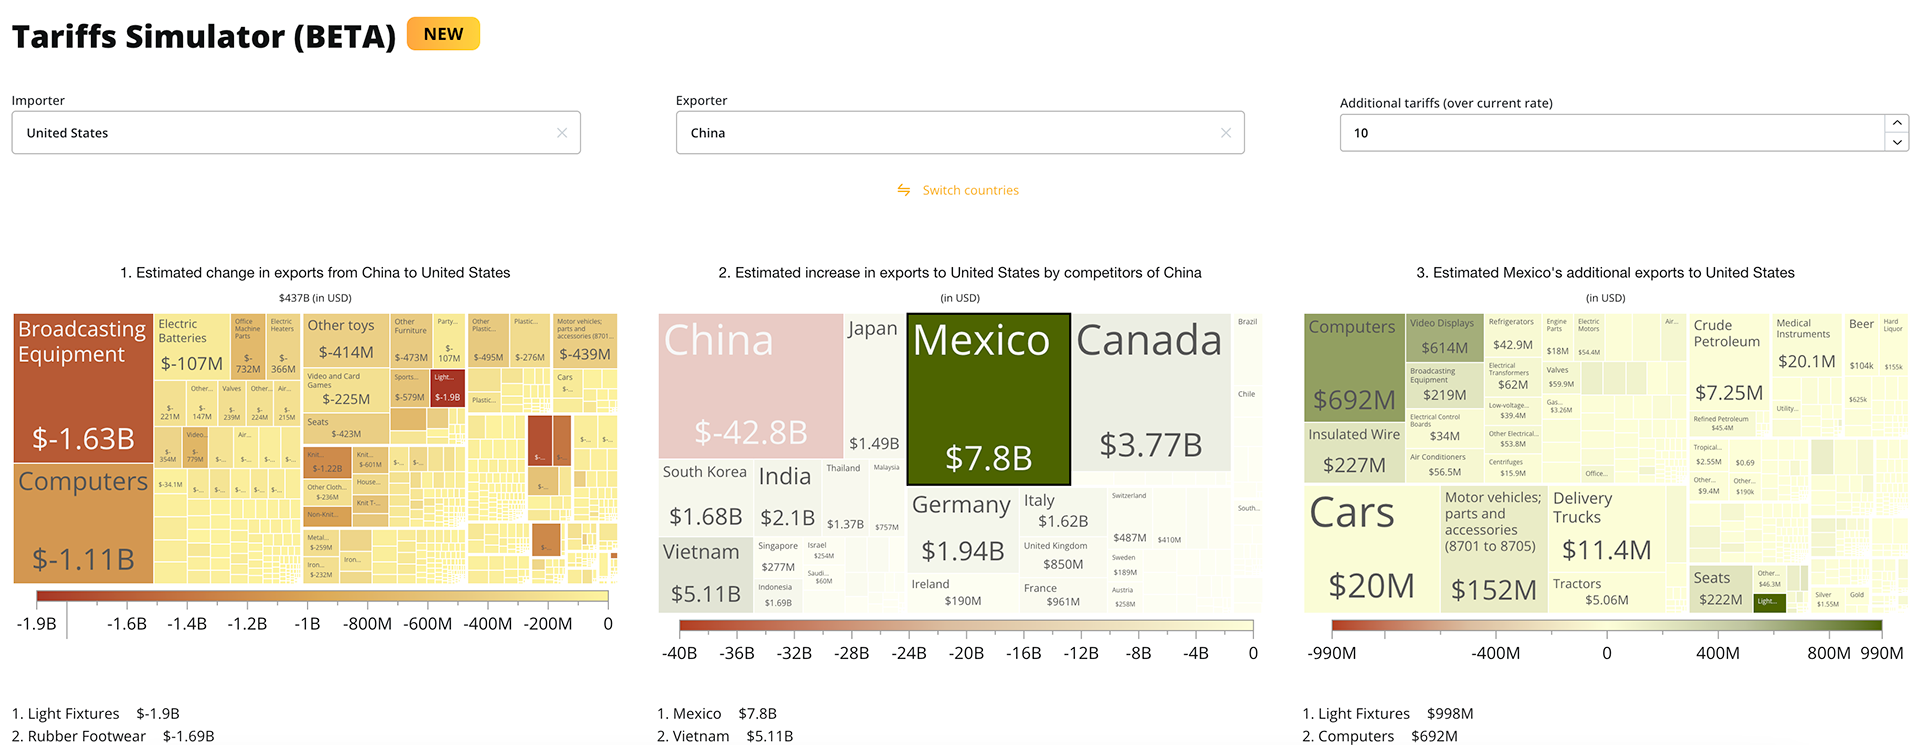
Tariffs Simulator — Developed for a Southeast Asian government entity in response to the 2025 US tariff changes, allowing policymakers to model the global impact of trade policy shifts and inform national investment strategy.
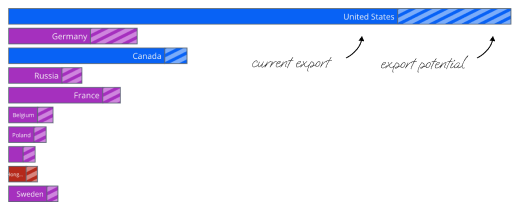
Export Potential Tool — Leveraged machine learning models trained on language, geography, colonial history, and market demand signals to answer questions like "Where should this country export this product?" — used by trade ministries and development banks.
Impact
The OEC today serves analysts, economists, policymakers, and entrepreneurs across the globe. By pairing rigorous product thinking with user-centred design, we transformed a dense data platform into an intuitive, high-value tool — increasing subscriptions, driving organic growth, and cementing OEC's position as the leading platform for economic complexity research.
What This Took
Shipping these outcomes required more than good design instincts. It meant making hard prioritisation calls with incomplete data, aligning a distributed team across time zones around a shared vision, navigating government procurement processes, and constantly translating between the technical language of data scientists and the outcome language of policy clients. That tension — between rigour and accessibility, between depth and growth — is what I find most interesting to solve.